Robometer logo Robometer: Scaling General-Purpose Robotic Reward Models
via Trajectory Comparisons

Anthony Liang*1Yigit Korkmaz*1Jiahui Zhang2Minyoung Hwang3Abrar Anwar1Sidhant Kaushik4

Aditya Shah5Alex S. Huang2Luke Zettlemoyer5Dieter Fox5,6Yu Xiang2Anqi Li7

Andreea Bobu3Abhishek Gupta5Stephen Tu†1Erdem Bıyık†1Jesse Zhang†5

1Univ. of Southern California  2UT Dallas  3MIT  4Indep. Researcher  5Univ. of Washington  6Ai2  7NVIDIA

*Equal contribution  Equal advising

Robometer: Dense, General-Purpose, Video-Language Reward Model


Specific Contributions

Training Rewards on Different Expertise Data
Robometer enables scalable training of rewards on both (1) reward-labeled / expert demonstrations and (2) reward-unlabeled, suboptimal trajectories. This enables well-calibrated, dense rewards usable zero-shot for policy learning.
RBM-1M Dataset
We release RBM-1M, a large-scale reward-learning dataset comprising over one million trajectories spanning diverse robot embodiments and tasks, including substantial suboptimal and failure data.
Downstream Applications
Robometer significantly improves robot learning performance across a diverse set of downstream applications, including model-free online RL, model-based online RL, offline RL, failure detection, and data retrieval for IL.

Method

Robometer method overview

Dual-Objective Training

Frame-Level Progress and Success Prediction
Anchors the magnitude of predicted rewards by regressing per-frame progress and success values on expert demonstration data, providing dense supervision at the intra-trajectory level.
Trajectory-Comparison Preference Prediction
Imposes global ordering constraints across pairs of trajectories of the same task, enabling robust learning from suboptimal and failed data via a preference comparison objective.
Robometer Training Objectives and Types

Model Training Inputs and Objectives

Different Expertise
We pair together expert and suboptimal trajectories of the same task, training per-frame progress/success prediction on the expert trajectory and training the model to prefer the expert trajectory.
Different Tasks
We pair trajectories of different tasks together, training the model to prefer the video corresponding to the correct input language instruction. We can train per-frame progress/success on both types of trajectories.
Augmented Trajectory
We also augment a given trajectory to simulate failures, for example by using video rewind. The model is trained to prefer the original, unaugmented trajectory, and per-frame progress/success prediction can occur on either trajectory.

RBM-1M Dataset

1M+

Trajectories

21

Robot Embodiments

140,000+

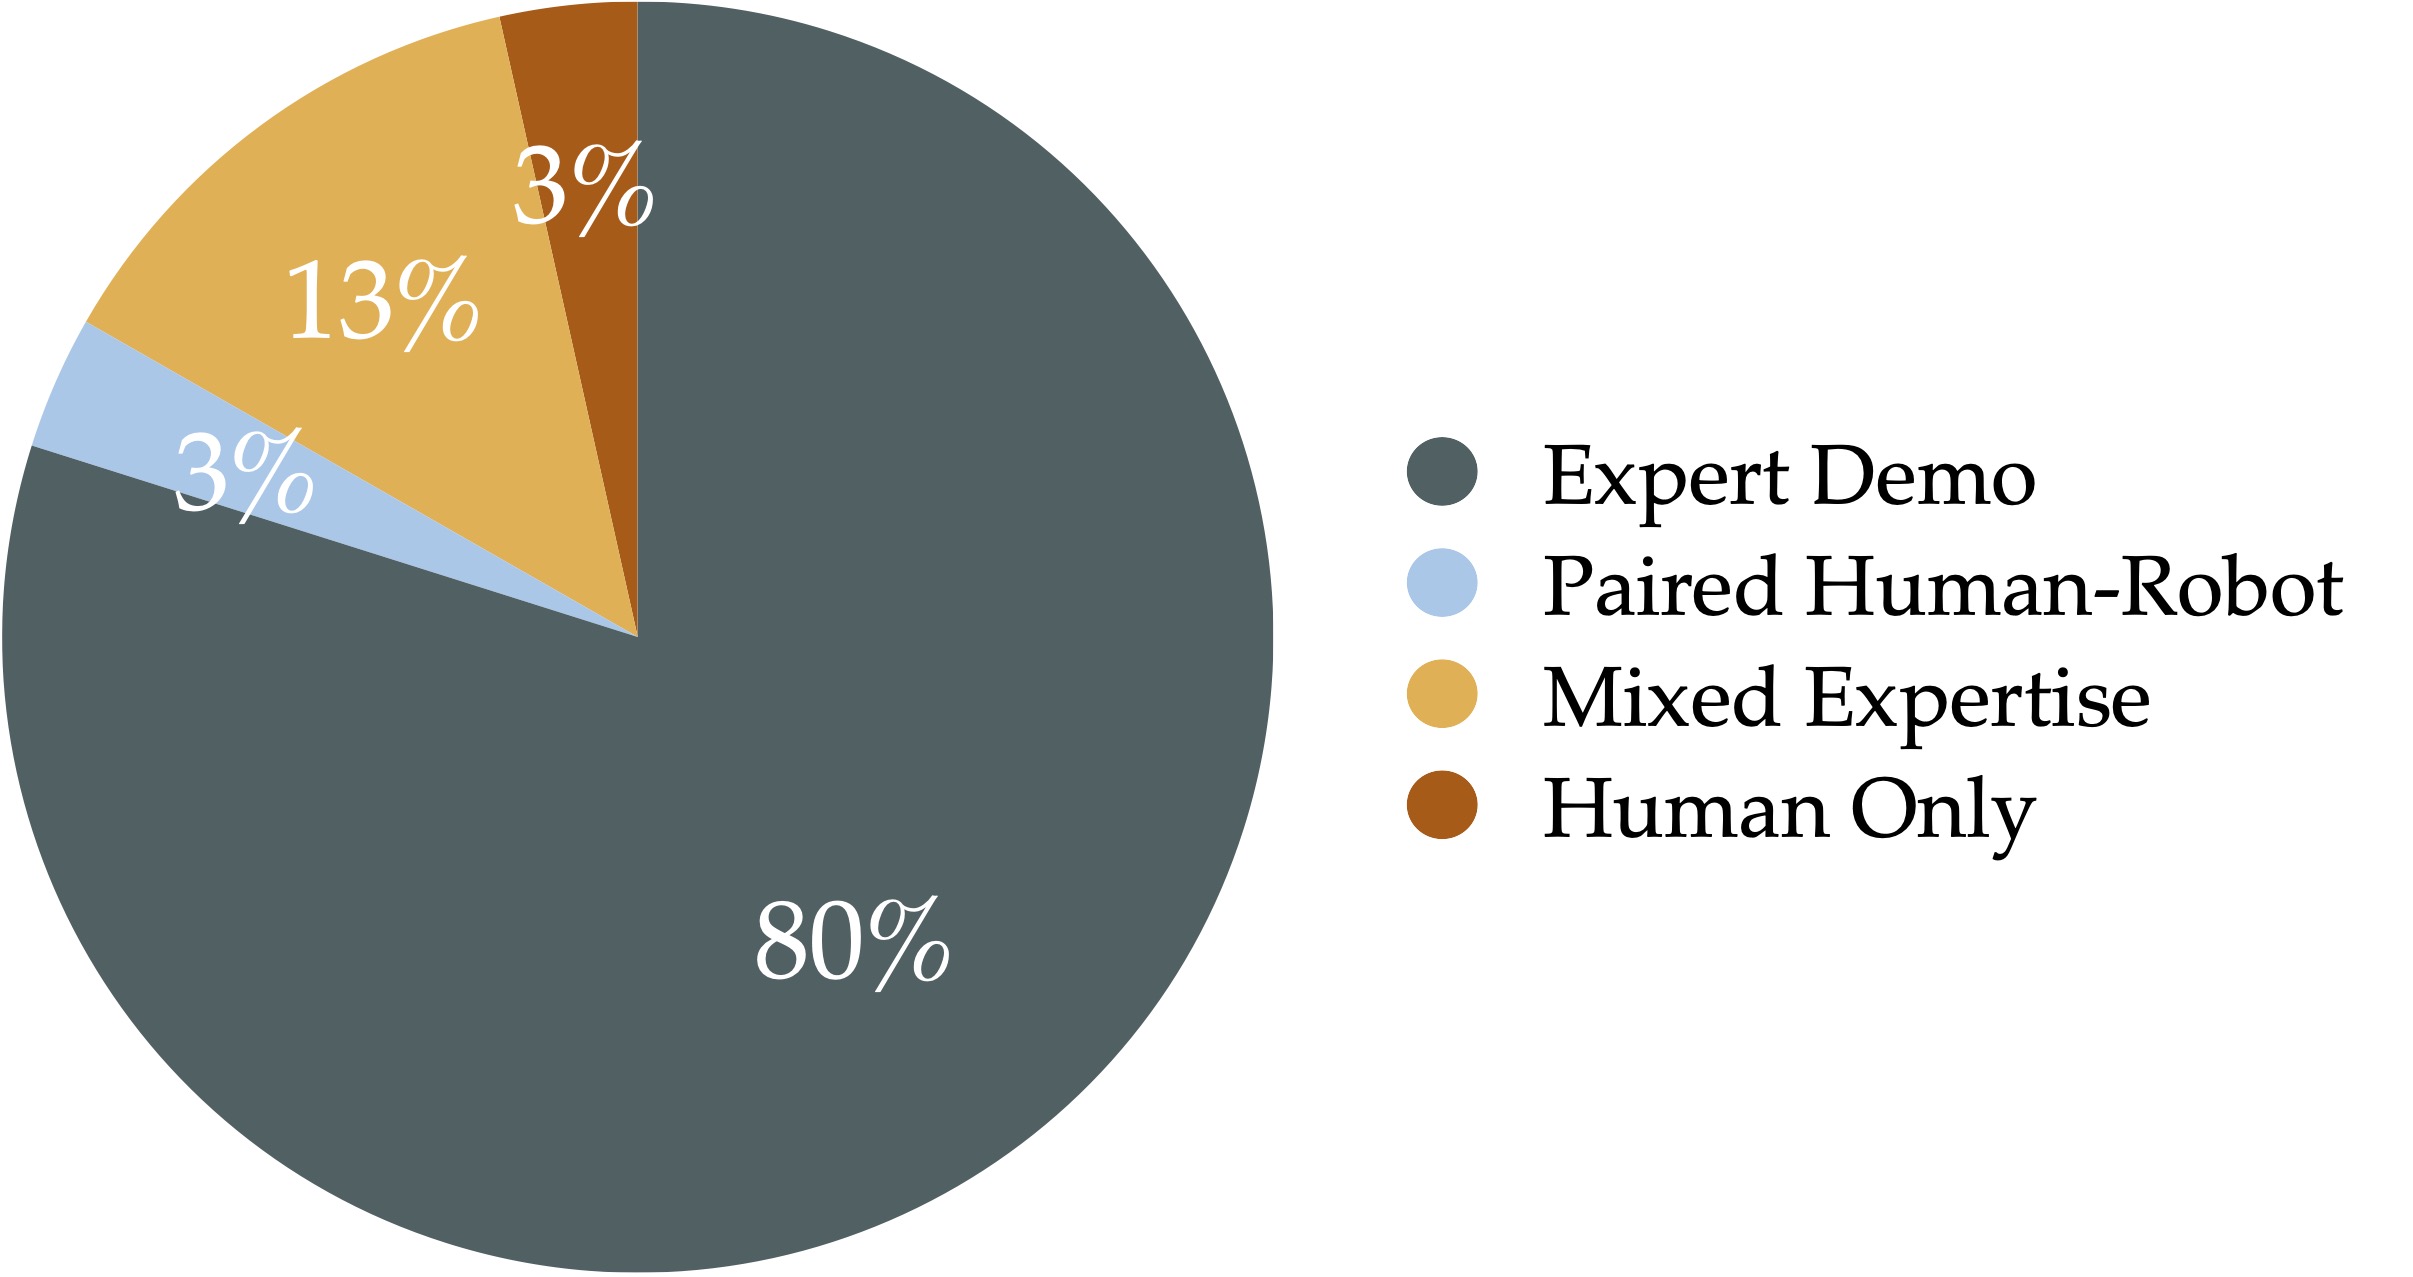
Trajs. from Mixed Expertise Datasets

RBM-1M statistics
Distribution of different trajectory types in RBM-1M.
Example Trajectory 1
Example Trajectory 2
Example Trajectory 3
Example Trajectory 4
Example Trajectory 5
Example Trajectory 6
Example trajectories from RBM-1M. Dataset composition across robot embodiments, tasks, and trajectory quality levels. Suboptimal and failure data constitute a substantial fraction, enabling the preference-based learning component of Robometer.

Offline Reward Model Evaluations

Video-language Reward Confusion Matrix

Failure detection confusion matrix
Video-language reward confusion matrix. For each task (unseen data), we score all video–instruction pairs. Robometer yields the most diagonal matrix, indicating strong alignment between demos and instructions. Values are column-normalized diagonal means (fraction of reward on aligned pairs).

Qualitative Reward Curves

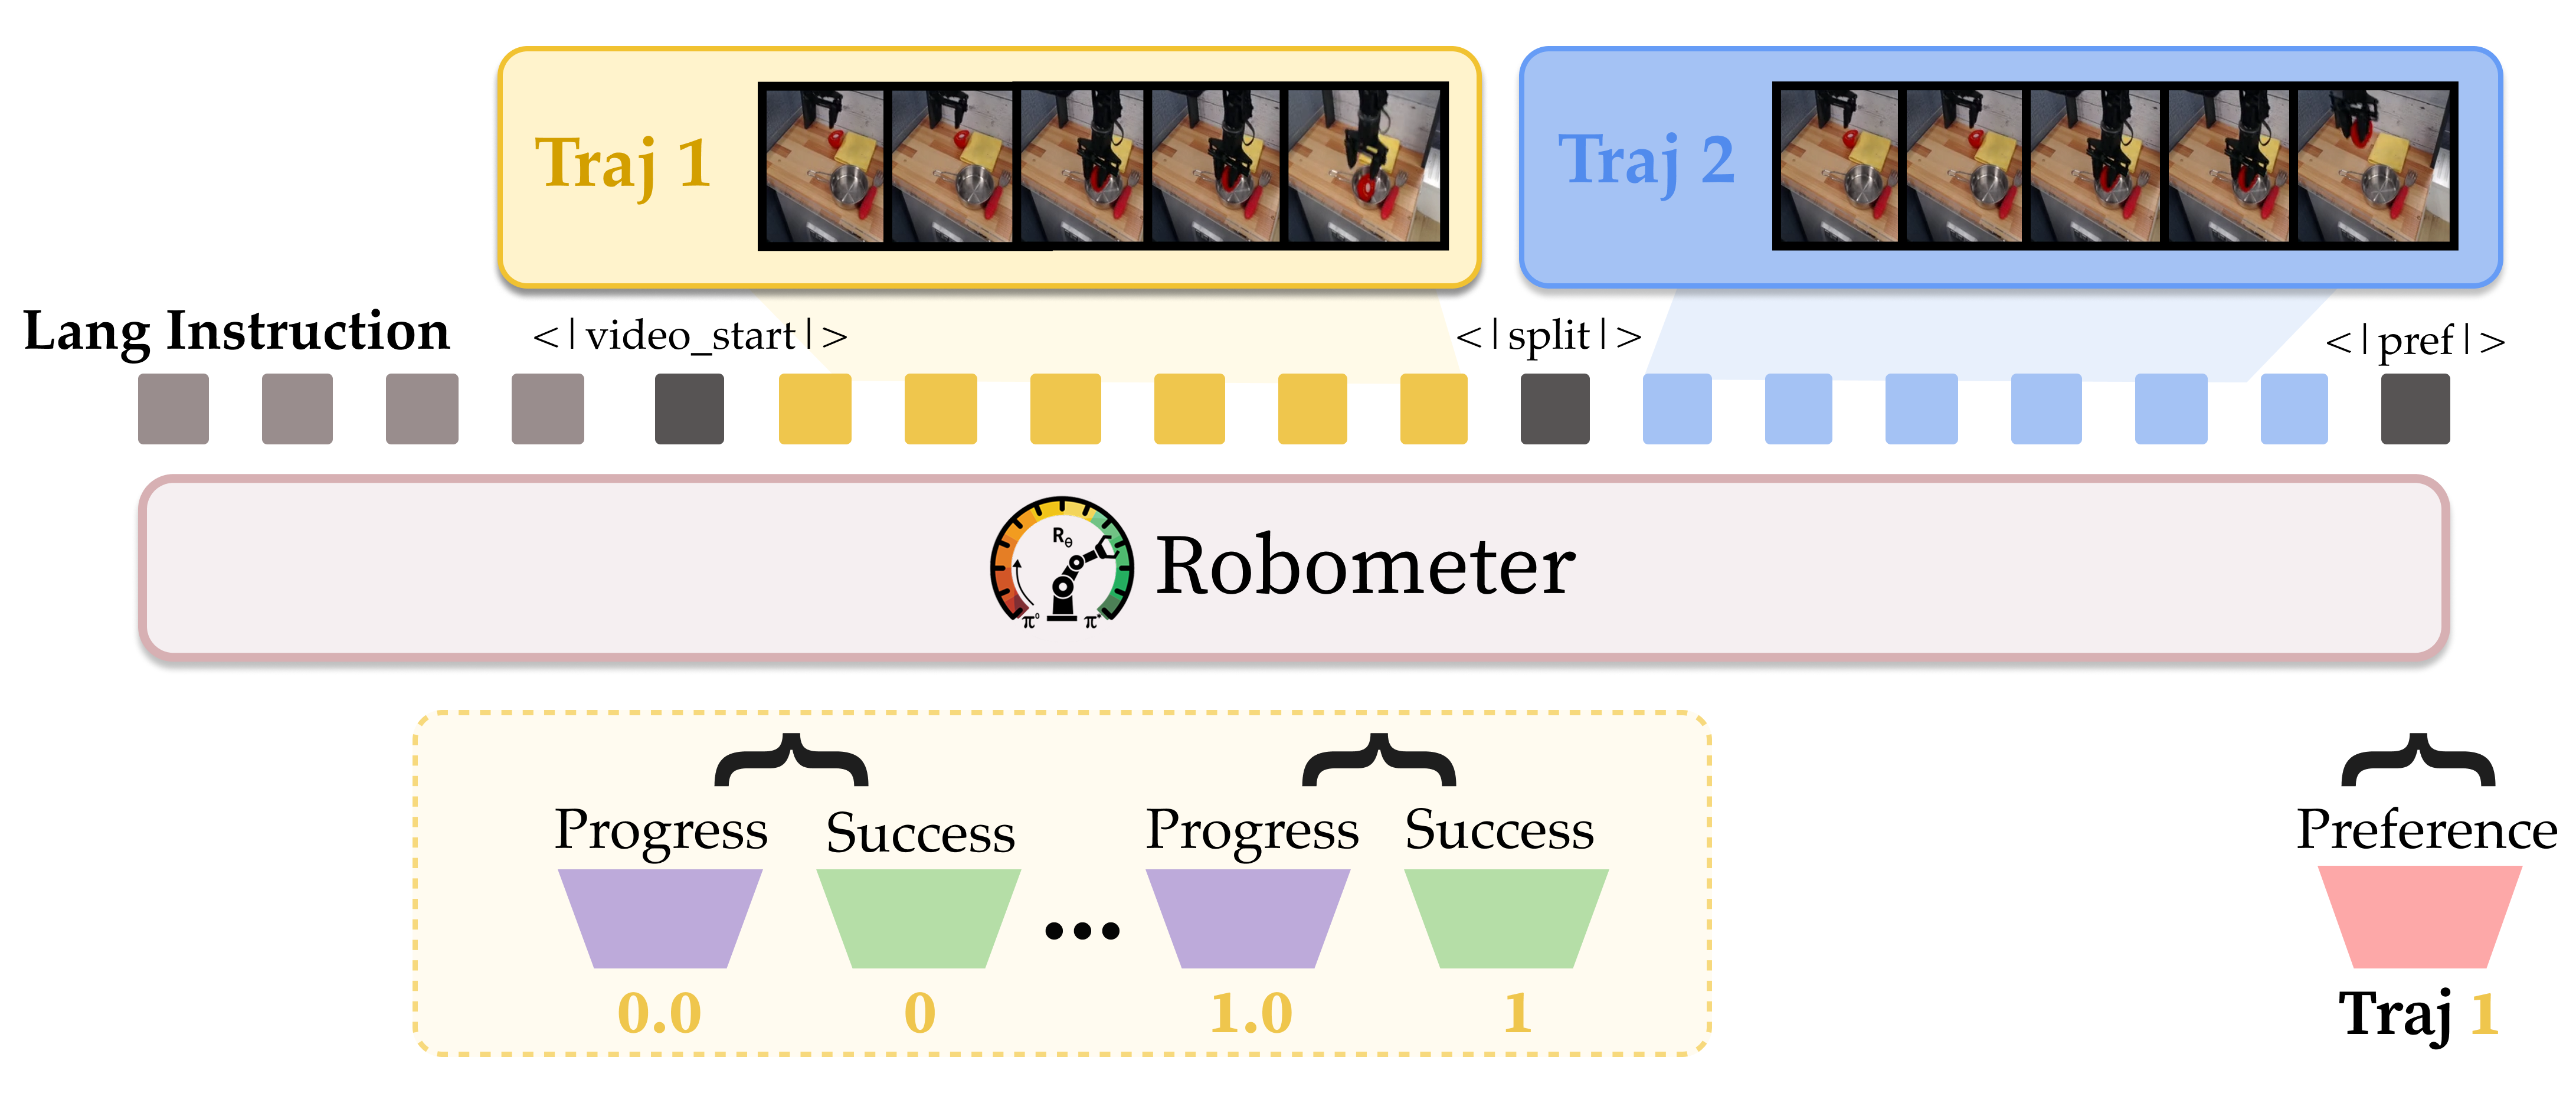
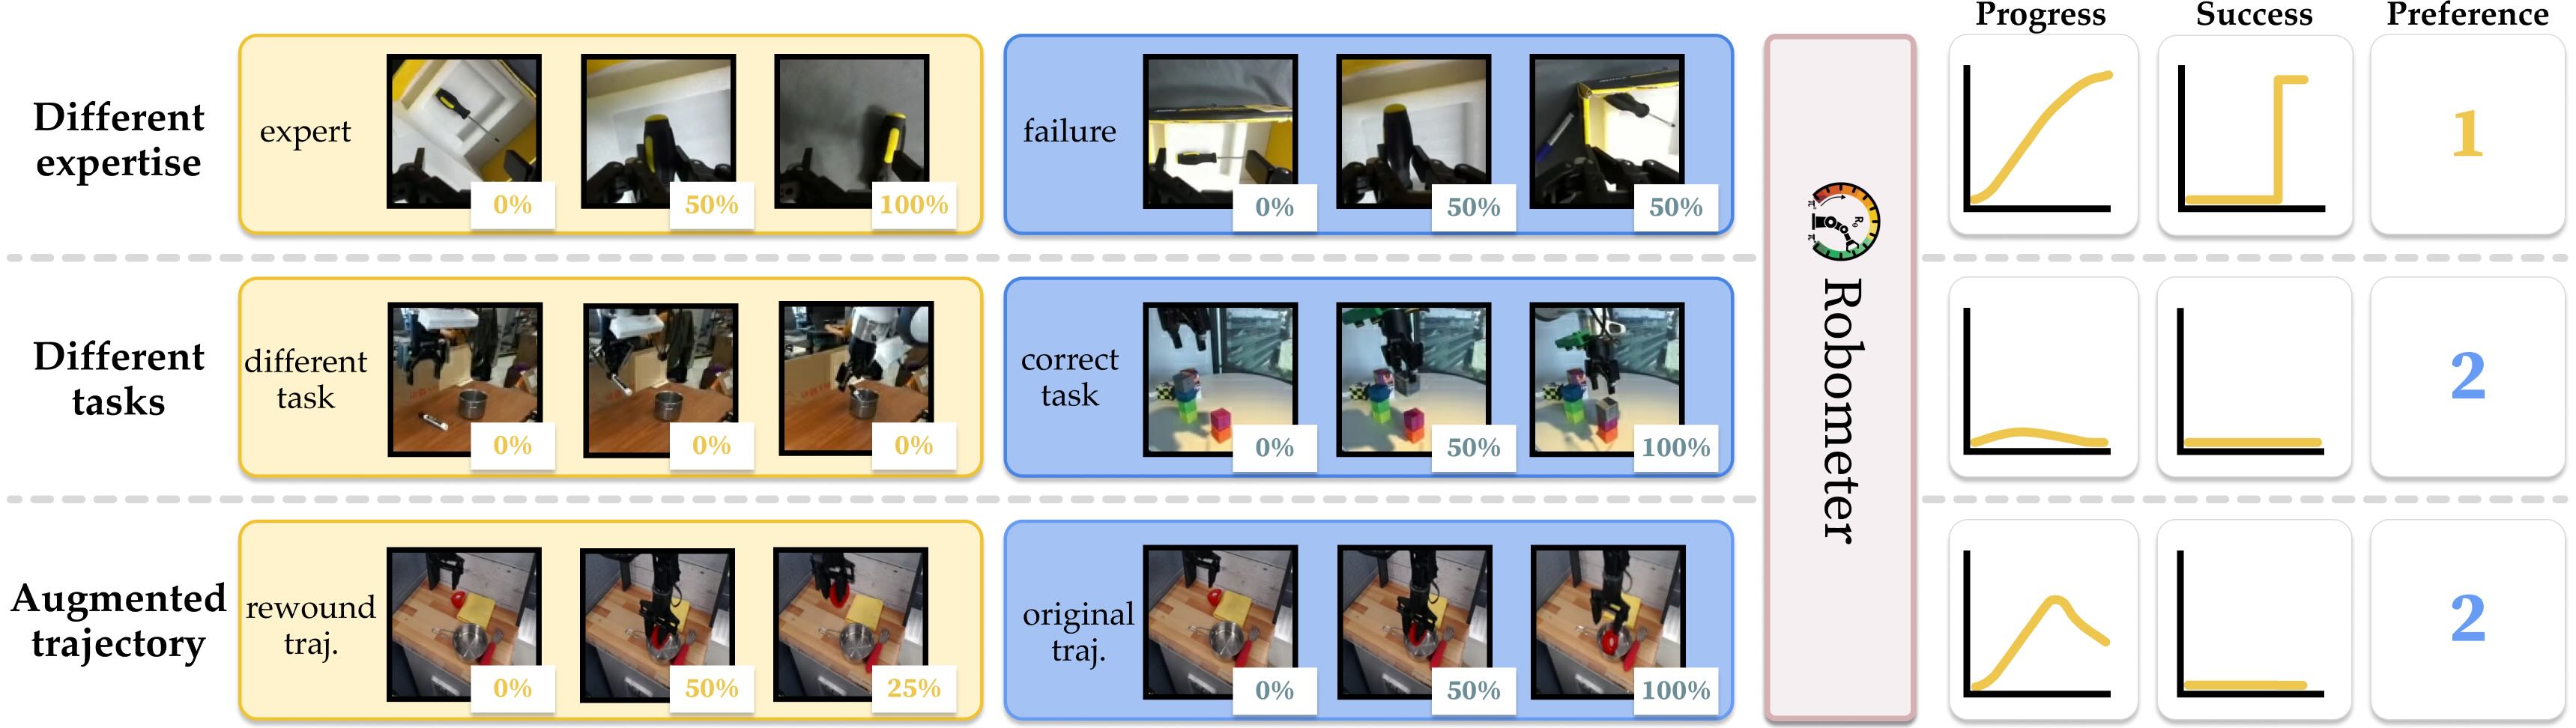
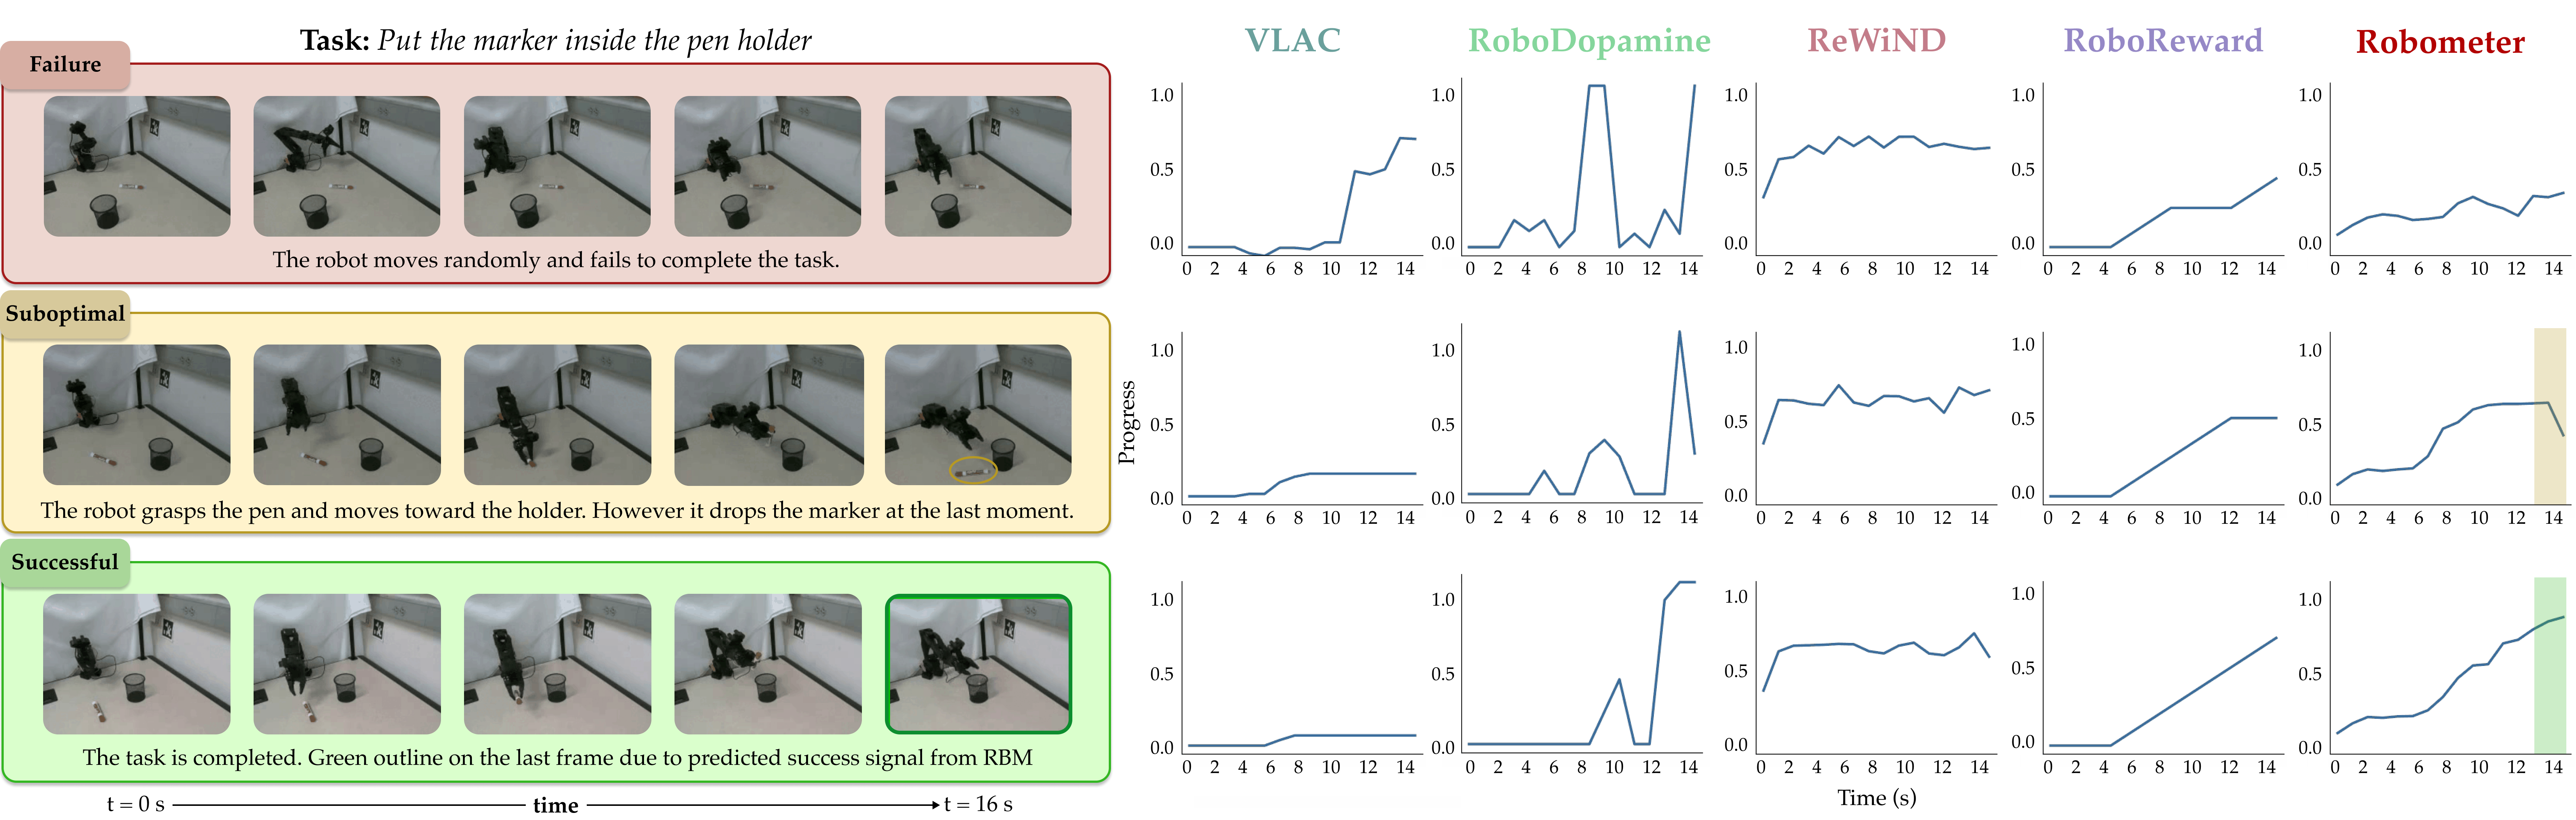
Reward curves predicted by Robometer and ablated variants on example trajectories.

Qualitative reward plots
Qualitative reward curves across expert, suboptimal, and failed trajectories. Robometer predictions reflect subtle failures and best align with true progress.

Quantitative Reward Evaluations

Setting. Reward alignment is measured with Value Order Correlation (VOC Pearson $r$) between predicted rewards and ground-truth progress; trajectory ranking is measured with Kendall $\tau$ on RBM-EVAL (in-distribution and out-of-distribution). We compare baselines (GVL, VLAC, RoboDopamine), models trained on RoboReward data, and ReWiND / Robometer on full RBM-1M.
Dataset Baselines w/ RoboReward Training Data w/ our RBM-1M data
GVL VLAC RoboDopamine RoboReward-4B RoboReward-8B Robometer ReWiND Robometer
(a) Reward alignment (VOC Pearson $r$) ↑
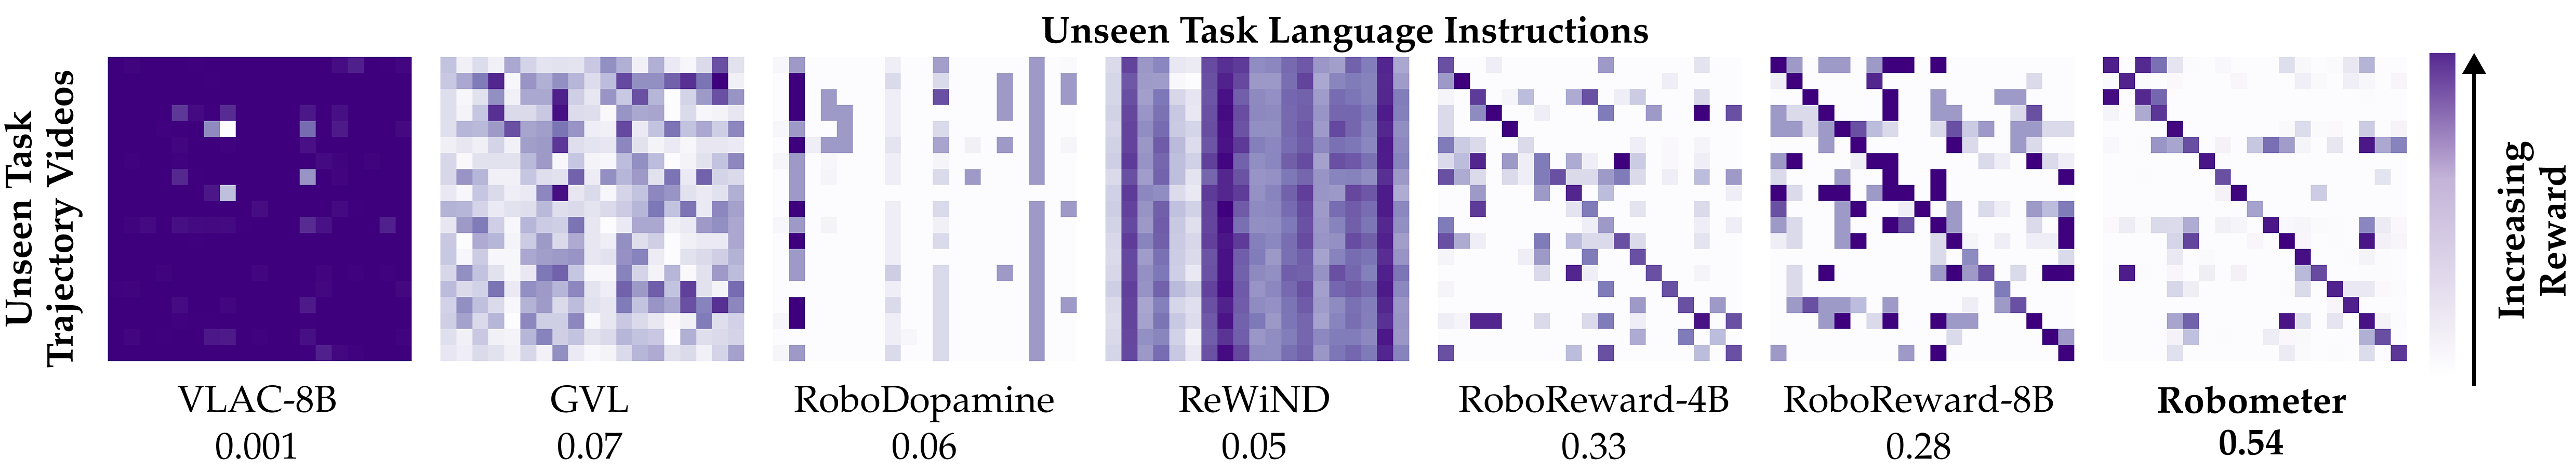
RBM-EVAL-ID0.160.160.130.770.820.840.460.92
RBM-EVAL-OOD0.210.170.080.880.880.930.510.95
(b) Trajectory ranking (Kendall $\tau$) ↑
RBM-EVAL-OOD0.190.080.110.500.470.550.010.66

(a) Reward alignment (VOC Pearson $r$) and (b) trajectory ranking (Kendall $\tau_a$) on RBM-EVAL. Baselines by training data: GVL (w/ GPT-5-mini, unknown data), VLAC (300k trajectories), RoboDopamine (100k). We compare Robometer to RoboReward-4B/8B on their data, and ReWiND and Robometer on the full RBM-1M dataset.

Setting. We evaluate on the RoboRewardBench benchmark: mean absolute error (MAE) between predicted rewards and human-annotated progress labels. Lower is better.
Model Type Model RoboRewardBench MAE ↓
Qwen3-4B Models Robometer (ours) 0.72
Robometer (RoboReward data only) 0.75
RoboReward-4B 0.85
Qwen3-VL-4B-Instr. 1.03

Evaluation on the RoboRewardBench benchmark (mean absolute error, lower is better).

Setting. We compare Robometer to RL-VLM-F on pairwise preference accuracy over 500 comparisons per RBM-EVAL-OOD dataset: (i) Different Quality — same task, different trajectory quality; (ii) Different Task — different tasks, model must prefer the trajectory matching the instruction.

Different Quality

Dataset RL-VLM-F (%) Robometer (%)
USC Franka52.175.0
USC Koch54.479.4
USC Trossen66.776.2
USC xArm48.688.9
MIT Franka54.485.4
UT Dallas SO-10156.790.0
Average55.582.5

Different quality trajectory pairwise preference accuracy.

Different task

Dataset RL-VLM-F (%) Robometer (%)
USC Franka70.7100.0
USC Koch54.789.8
USC Trossen64.099.0
USC xArm73.398.2
MIT Franka55.398.4
UT Dallas SO-10172.7100.0
Average65.197.6

Different task trajectory pairwise preference accuracy.

Reward curves by task

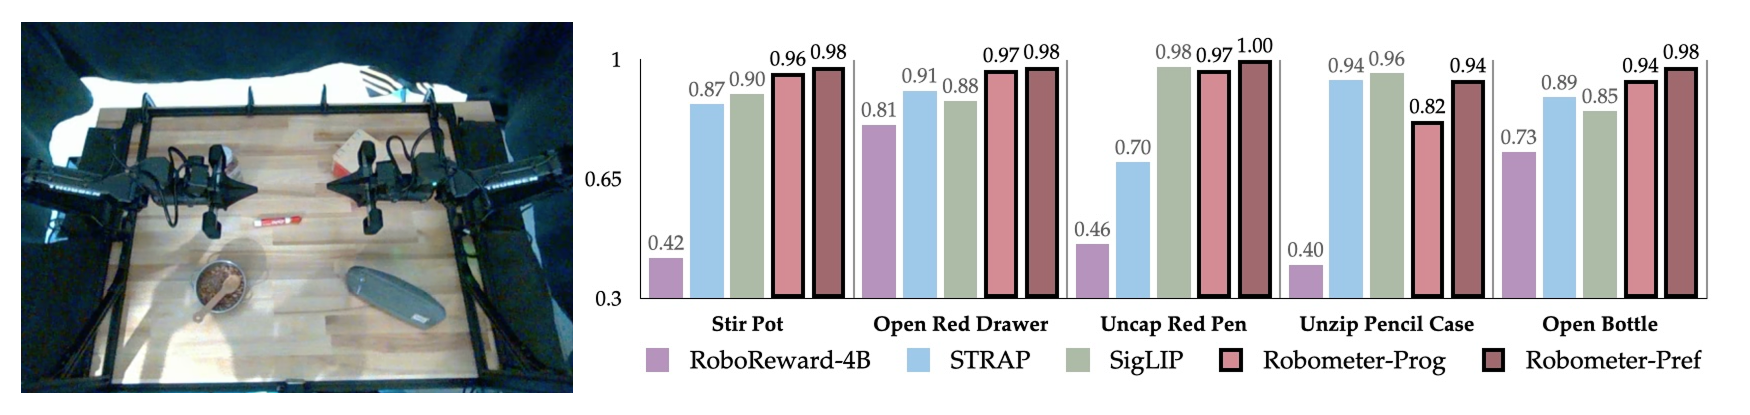
Select a task to view the reward curve video.

Policy Learning Experiments

Robometer is evaluated across five diverse downstream applications. In every setting Robometer is used as a plug-in reward function without task-specific fine-tuning.

Setting. Robometer rewards are used as dense reward signals for single-stage, online reinforcement learning with DSRL + $\pi_0$. Successes are *automatically* detected by the reward model.
RoboReward 100x speed real world training clip. RoboReward consistently falsely predicts success/full reward before the robot finishes the task, leading to poor evaluation performance.
Robometer 100x speed real world training clip.
Method Success Rate ↑
$\pi_0$ base (before RL) 0.20
RoboReward 0.55
Robometer (ours) ✓ 0.85
Setting. Robometer rewards are used as dense reward signals for multi-stage online policy learning with DSRL + $\pi_0$. We perform a long-horizon, multi-stage RL task by using a VLM to break down the task into 2 sub-tasks, "put the corn in the pot on the dish rack" and "put the pot lid on the pot in the dish rack". Successes and stage advancement are *automatically* detected by the reward model.
RoboReward Multi-stage RL at 100x speed. RoboReward is often falsely predicts success for the first stage when the robot drops the corn next to but not into the pot, leading to poor downstream evaluation performance where the robot rarely puts the corn into the pot.
Robometer Multi-stage RL at 100x speed. Robometer is robust to when the robot drops the corn next to but not into the pot, leading to few false stage advancements.
Method Success Rate ↑
$\pi_0$ base (before RL) 0.20
RoboReward 0.20
Robometer (ours) ✓ 0.70

Robometer Demo

Try the reward model evaluation UI below, or separate visit in a new tab at https://robometer-rewardeval-ui.hf.space.

Low-rank Finetuning of Robometer

Robometer serves as a strong initialization for domain-specific reward fine-tuning: practitioners can adapt it to new tasks or embodiments with limited data and compute (e.g., LoRA with a single GPU) instead of training a reward model from scratch. We demonstrate this on RoboFAC; fine-tuning from Robometer substantially outperforms fine-tuning the base VLM across reward and ranking metrics.

Method VOC $r$ ↑ Kendall $\tau$ ↑ Succ-Fail Diff ↑
Robometer-4B (Zero-shot)0.6520.4360.141
Qwen3-VL (LoRA)0.7010.0670.005
Qwen3-VL (Full FT)0.7270.1020.008
Robometer-4B (LoRA)0.8750.7860.271
Robometer-4B (Full FT)0.8840.8020.302

BibTeX

@article{liang2026robometer, title = {Robometer: Scaling General-Purpose Robotic Reward Models via Trajectory Comparisons}, author={Anthony Liang and Yigit Korkmaz and Jiahui Zhang and Minyoung Hwang and Abrar Anwar and Sidhant Kaushik and Aditya Shah and Alex S. Huang and Luke Zettlemoyer and Dieter Fox and Yu Xiang and Anqi Li and Andreea Bobu and Abhishek Gupta and Stephen Tu and Erdem Biyik and Jesse Zhang}, year={2026}, journal = {arXiv preprint arXiv:2603.02115} }